Tips / Sunday June 7, 2026
Website Metrics to Track for Better Performance and Conversions

The most important website metrics to track are visitors, session duration, traffic sources, conversion rate, bounce rate, and exit pages because they reveal how users interact with your website and where improvements can increase conversions. Monitoring these metrics helps you measure the effectiveness of your content, marketing campaigns, and overall user experience.
While tools like Google Analytics provide a vast amount of data, focusing on a handful of key performance indicators makes it easier to identify opportunities and address problems before they affect your results. By understanding which pages attract visitors, where traffic originates, how long users stay, and what actions they take, you can make informed decisions that improve engagement, reduce abandonment, and support long-term business growth.
Visitors
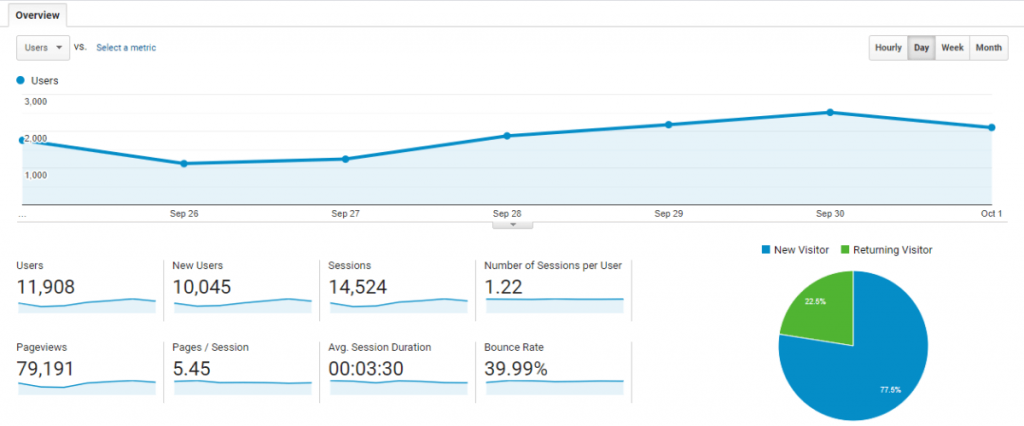
Naturally, the most important aspect of analyzing is your traffic. Without a fair amount of traffic, examining the rest of the metrics lowers their effect. When tracking visitors, there are a few aspects that you need to pay attention to.
First and foremost, the number of unique visitors. This metric represents the number of people who visited your website during a specific period of time – an hour, a day, a week, a month. Unique visitors indicate the number of individuals who have browsed your website within a specified timeframe, regardless of how many times they have visited it. Apart from having an idea of how big your audience is, you can also determine how effective your current marketing campaign is. Let’s say you have recently started running a new ad campaign, but you do not notice any increase in the number of unique visitors to your website. This can clearly lead you to conclude that the campaign does not have the desired effect, and you should focus your energy and money in another direction.
Second, the number of returning visitors. As the name suggests, these are the visitors who accessed your website more than once in a specific time frame. The percentage of returning visitors is also crucial, as it indicates that you have given users a reason to return to your website, whether they are engaged by your content or would like to purchase your products.
Google Analytics comes with a handy feature called “Goals”. It allows you to define specific criteria to track and estimate each visitor’s value by dividing your revenue by the number of unique visitors to your website. This insight can help you prioritize your marketing campaigns and, consequently, lower your expenses by boosting conversions.
Session Duration
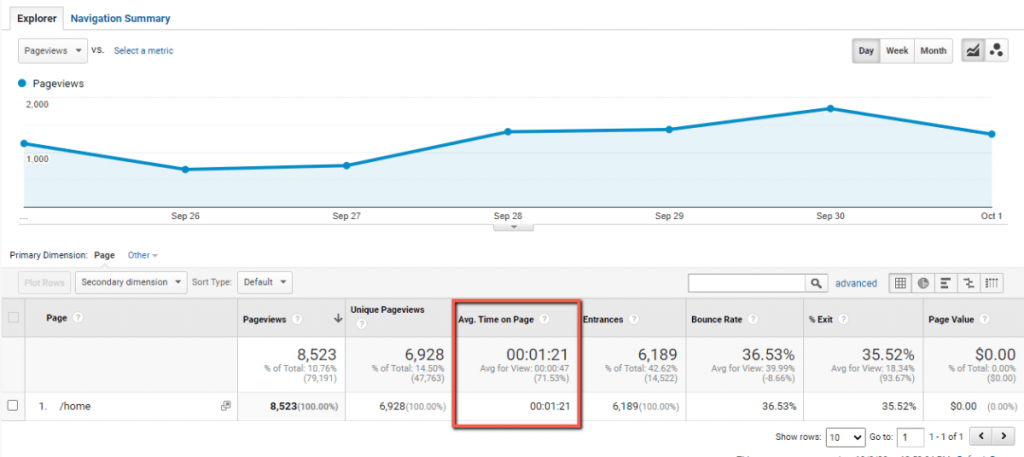
The session duration metric indicates how much time visitors spend on your website per visit. In other words, you can determine how engaging your website content is for visitors – the longer they stay, the more compelling your content is. According to research, most users tend to spend less than 15 seconds on a web page unless you manage to attract their attention. Poorly written content may lead to your visitors abandoning you immediately. In contrast, well-written and engaging content will indeed extend the time they spend on your website and potentially increase the possibility of a successful conversion.
In Google Analytics, you can find the average session duration. Please note that the algorithm is based on user interactions, and if a user is inactive for more than 30 minutes, the session will be considered closed. In other words, if you have long articles, tutorials, videos, etc., this might not be the most accurate metric for you.

Apart from the average session duration, Google Analytics also shows you the average time spent on a per-page basis. This metric is invaluable in two directions. You can learn which pages of your website are not performing well and need some improvement. It can also show you which pages are more engaging and help you determine your future content strategy.
It is essential to know that the average time spent on pages is used by search engines, such as Google, to determine your content’s quality. Search engine bots cannot determine how relevant and well-written your content is. Therefore, they use the time session duration as an indicator of the efficiency of your web content.
Top Pages
It is important to be aware of which website pages are the most popular and perform best in terms of user engagement. Identifying which topics interest your website visitors will ultimately help you base your future content strategies on facts.
In Google Analytics, you can find the top-performing pages in terms of traffic volume.

Analyzing the content types of the top pages will help you identify the topics your audience is most interested in. You can create similar content or review these topics in-depth.
Interactions Per Visit
It is essential to understand your visitors’ behavior and how they interact with your website. Analyzing the users’ behavior, such as the time they spent on your website, the links they clicked, and the pages they visited, will help you determine the path taken to the successful conversion. This will help you determine which user interactions are most likely to lead the visitor to purchase. On the other hand, you can examine which interactions lead to visitors’ abandonment and help you decide what adjustments you need to make to avoid or at least minimize the bounce-back rate in the future.
Top Traffic Sources
The traffic sources will help you understand where your website visitors are coming from. This metric is also critical, especially if you are running paid advertisement campaigns.
There are three primary traffic sources: direct traffic, organic search, and referrals.
Direct traffic consists of visitors who access your website by entering the URL in their browser. Organic searches indicate the traffic formed by visitors who found you through search engines. Referrals are based on visitors who were redirected to your website from another third-party website where you were mentioned.

Examining which traffic sources bring most of your visitors will help you determine how effective your current marketing campaign is. If you detect that a given traffic source’s bounce rate is higher, it indicates that it brings irrelevant traffic that is not necessarily interested in your brand. In such a scenario, you will need to reconsider your efforts and focus on another strategy to attract relevant users with the potential for conversion.
Conversion Rate
The conversion rate indicates the percentage of users who were successfully converted for a particular website page. Conversion rates indicate the success of the action you want your visitors to perform on a specific page. Naturally, higher conversion indicates the page in question is performing effectively.
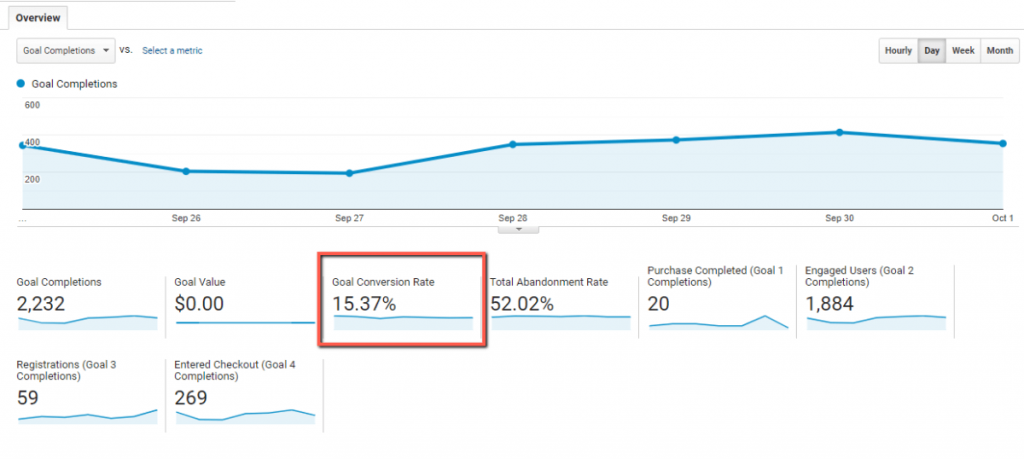
Comparing pages with higher conversion rates to those with lower conversion rates will help you identify which aspects require improvement, whether it is design, calls to action, or content.
Bounce Rate
The bounce rate is the percentage of visitors who leave your website immediately after visiting, without any further interaction. This makes it one of the most crucial tracking metrics. Naturally, your goal should be to keep the bounce rate as low as possible.

A high bounce rate indicates there is a specific issue with a particular page. You need to identify the pages with the highest bounce rates and focus on improving them. While the issue may relate to design or content, an ineffective marketing campaign can also significantly impact it. Intuitively, if you attract an irrelevant audience, it is normal to have a high bounce rate.
Exit Pages
Exit pages indicate the pages your visitors leave your website from. Analyzing your website users’ paths and exit pages will help you understand where they are abandoning your website. You can revisit the pages with the highest exit rates and determine which factors may be contributing to the issue.

Whether it is a complicated checkout process, unattractive design, or poorly written content, you surely need to pay attention to the exit pages and dedicate your efforts to improving them.
Conclusion
The most important part of improving your tactics based on these metrics is to identify which metrics have the greatest impact on your business and to be consistent. The metrics we have reviewed are generally the most important ones providing genuinely accurate information, the key is to learn how to accurately analyze it and put the necessary efforts in improving the elements of your website and marketing campaigns.
If you are not getting the desired results, there are several reasons that could be affecting your website’s performance. One of them is your website speed. It has a significant influence on your user experience and, therefore, could consequently lead to higher bounce-back rates and unsuccessful conversions. While quite a few factors determine your website’s loading speed, the hosting server plays a notable role. As a hosting provider that aims to deliver the best possible speed and overall performance, HostArmada has gone the extra mile to optimize our server environment. More about our services, you can find in the comprehensive review generated by Online Web Service after testing our hosting plans.
FAQs
The most important website metrics include visitors, session duration, traffic sources, conversion rate, bounce rate, exit pages, and engagement metrics. Together, they provide a clear picture of website performance and user behavior.
Conversion rate measures the percentage of visitors who complete a desired action, such as making a purchase or submitting a form. It directly reflects how effectively your website turns traffic into customers or leads.
A good bounce rate varies by industry and page type, but generally, a bounce rate between 26% and 40% is considered excellent, while rates above 70% may indicate content or user experience issues.
Most websites should review key metrics weekly to identify trends and issues quickly, while conducting more detailed monthly and quarterly analyses to evaluate long-term performance and marketing effectiveness.